


Data governance metrics are the foundation of an effective governance program. They help organizations measure data quality, security, compliance, privacy, and operational performance, turning governance from a policy exercise into a measurable business function.
By tracking the right data governance KPIs and performance metrics, organizations can reduce compliance risk, improve data trust, strengthen audit readiness, and make better business decisions. This is especially important as regulations like GDPR, HIPAA, and SOC 2 continue to raise expectations around data accountability and protection.
This guide covers the most important data governance metrics and KPIs, real-world examples, scorecards, reporting frameworks, and best practices for measuring governance success.
Quick navigation
- What are data governance metrics?
- What are the 5 pillars of data governance?
- Data governance KPIs vs metrics
- What are the 4 types of data governance metrics?
- Data governance metrics and KPIs: Key areas to measure
- Data quality metrics
- Data protection metrics and privacy KPIs
- Governance scorecards
- How to report on data governance metrics effectively
- Tools for monitoring data governance metrics
- Common obstacles to tracking data governance metrics
- Best practices for tracking data governance metrics
- How to implement data governance metrics: 5-step framework
- FAQs
What are data governance metrics?
Data governance metrics are measurable indicators used to evaluate how effectively an organization manages data quality, security, compliance, accessibility, stewardship, and lifecycle governance.
They help organizations assess whether their data governance policies and processes are supporting business, security, privacy, and compliance goals. While these metrics do not solve governance issues on their own, they provide visibility into what is working, where risks exist, and which areas require improvement.
In many ways, data governance metrics act as dashboards for governance programs. They help organizations continuously monitor controls, simplify audits, and maintain evidence for frameworks such as GDPR, HIPAA, SOC 2, and ISO 27001.
Examples of data governance metrics include:
- Data accuracy rate
- Percentage of completed access reviews
- Policy exception count
- DSAR fulfillment timelines
- Encryption coverage
- Data retention compliance rate
These metrics are commonly tracked by CISOs, compliance managers, data stewards, and IT teams to reduce risk, improve accountability, and strengthen trust in organizational data.
What are metrics in data governance?
Metrics in data governance are measurable values used to track the effectiveness of governance processes, controls, and policies. They help organizations monitor areas such as data quality, privacy, security, compliance, accessibility, and stewardship to ensure data is accurate, secure, and managed consistently across the organization.
What are the metrics of data governance?
Common types of data governance metrics include:
- Data quality metrics
- Data governance performance metrics
- Data protection metrics
- Data privacy KPIs
- Metadata metrics
- Stewardship metrics
- Compliance metrics
- Access control metrics
Let’s define the core terms
1. Data
Raw facts or digital records collected and stored by an organization, such as customer information, transaction histories, employee records, or system logs.
2. Governance
The policies, processes, and controls used to manage data responsibly and ensure it remains secure, accurate, accessible, and compliant with internal and external requirements.
3. Metrics
Quantitative measurements used to track performance, progress, and trends. In data governance, metrics help measure the effectiveness of controls related to security, privacy, quality, compliance, and access management.
What are the 5 pillars of data governance?
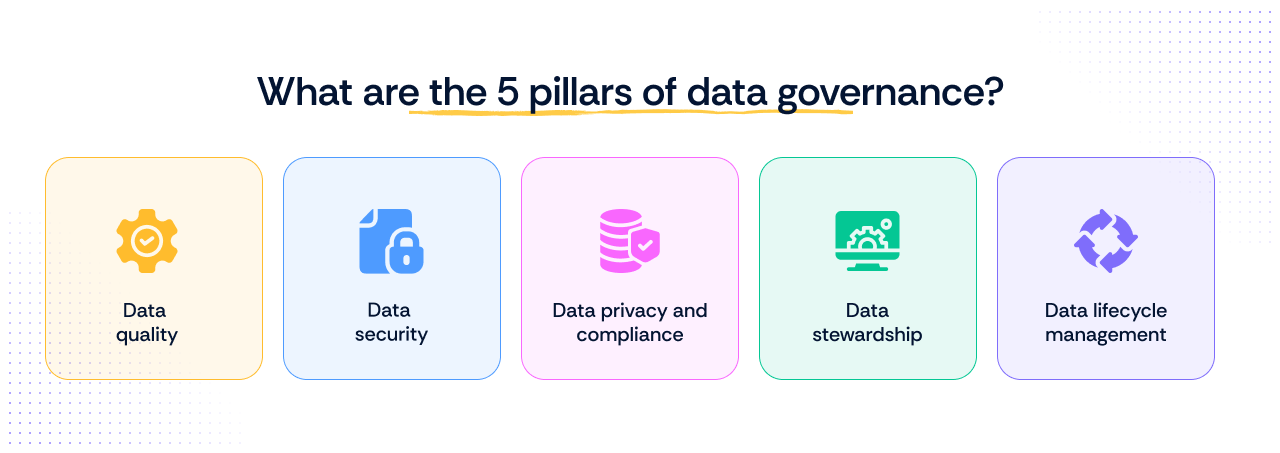
A strong data governance program is built on five core pillars that help organizations manage data securely, accurately, and consistently across the business.
1. Data quality
Data quality ensures that organizational data is accurate, complete, consistent, timely, and reliable. Poor-quality data can lead to reporting errors, compliance failures, and flawed business decisions.
Common data quality metrics include:
- Accuracy rate
- Completeness percentage
- Duplicate record rate
- Data validation error rate
2. Data security
Data security focuses on protecting sensitive information from unauthorized access, misuse, or breaches. This pillar includes access controls, encryption, monitoring, and incident detection.
Common security metrics include:
- Failed login attempts
- Encryption coverage
- Access review completion rate
- Mean time to detect incidents
3. Data privacy and compliance
This pillar ensures that data handling practices align with regulations such as GDPR, HIPAA, SOC 2, PCI DSS, and CCPA. It focuses on lawful data processing, consent management, retention policies, and audit readiness.
Common privacy and compliance KPIs include:
- DSAR fulfillment timelines
- Policy violation count
- Audit readiness score
- Data retention compliance rate
4. Data stewardship
Data stewardship defines accountability for managing and maintaining data assets across the organization. Data stewards help enforce governance policies, resolve ownership issues, and maintain data integrity.
Common stewardship metrics include:
- Steward assignment coverage
- Time to ownership resolution
- Governance policy acknowledgment rate
5. Data lifecycle management
Data lifecycle management governs how data is created, stored, archived, retained, and deleted throughout its lifecycle. Effective lifecycle management reduces storage costs, improves compliance, and minimizes unnecessary risk exposure.
Common lifecycle metrics include:
- Retention policy coverage
- Archived data compliance rate
- Data deletion completion rate
Data governance KPIs vs metrics: What’s the difference?
Data governance metrics and KPIs are closely related, but they serve different purposes.
Metrics measure operational activities and performance data, while KPIs measure whether governance initiatives are achieving strategic business, security, and compliance goals.
For example, tracking the number of failed access reviews is a metric. Measuring whether your organization achieved its quarterly compliance target based on those reviews is a KPI.
Organizations need both data governance metrics and KPIs to understand day-to-day governance performance while also evaluating broader business and compliance outcomes.
What are data governance key performance indicators?
Data governance key performance indicators (KPIs) are strategic measurements used to evaluate whether governance initiatives are meeting business, compliance, security, and operational goals.
Examples of data governance KPIs include:
- Audit readiness score
- Percentage of completed access reviews
- DSAR completion rate within SLA
- Reduction in policy violations
- Data quality improvement over time
While metrics provide operational visibility, KPIs help leadership measure the effectiveness and maturity of the overall governance program.
What are data governance key performance indicators?
Data governance key performance indicators (KPIs) are strategic measurements used to evaluate whether governance initiatives are meeting business, compliance, security, and operational goals. They help organizations measure the effectiveness of governance programs, track progress over time, and identify areas that require improvement.
What are the 4 types of data governance metrics?
Data governance metrics generally fall into four main categories: process metrics, quality metrics, risk and compliance metrics, and business impact metrics. Together, these metrics help organizations measure how effectively their governance program supports security, compliance, operational efficiency, and business outcomes.
1. Process metrics
Process metrics measure how efficiently governance activities and workflows are being executed across the organization.
Examples include:
- Percentage of completed access reviews
- Policy acknowledgment rates
- Time taken to resolve governance issues
- Metadata classification coverage
These metrics help organizations monitor governance operations and identify process bottlenecks.
2. Quality metrics
Quality metrics measure the accuracy, completeness, consistency, and reliability of organizational data.
Examples include:
- Data accuracy rate
- Duplicate record percentage
- Missing field percentage
- Data validation error rate
Strong data quality metrics improve reporting accuracy, analytics reliability, and decision-making.
3. Risk and compliance metrics
Risk and compliance metrics measure how effectively organizations manage security, privacy, and regulatory obligations.
Examples include:
- Audit readiness score
- Policy exception count
- DSAR fulfillment rate
- Encryption coverage
- Third-party risk assessment completion rate
These metrics are critical for frameworks such as GDPR, HIPAA, SOC 2, PCI DSS, and ISO 27001.
4. Business impact metrics
Business impact metrics measure how governance initiatives contribute to broader organizational outcomes.
Examples include:
- Reduction in compliance incidents
- Faster audit preparation time
- Improved customer trust scores
- Reduced operational downtime caused by poor data quality
These metrics help leadership connect governance investments to measurable business value.

Data governance metrics and KPIs: Key areas to measure
Effective data governance is not just about creating policies. It is about measuring whether those policies improve data quality, security, compliance, accessibility, and operational efficiency. The right data governance metrics and KPIs help organizations identify gaps, reduce risk, and continuously improve governance maturity.
1. Data quality metrics
Data quality metrics assess how trustworthy, usable, and accurate organizational data is across key dimensions. Poor data quality can lead to reporting errors, failed audits, operational inefficiencies, and poor business decisions.
Common data quality metrics include:
- Accuracy
- Completeness
- Consistency
- Timeliness
- Uniqueness
- Validity
- Integrity
What are the 7 data quality metrics?
These metrics are foundational to any strong data quality framework and support reliable reporting, analytics, and compliance outcomes.
Example: A financial services company discovers that 15% of customer records contain mismatched addresses across systems. To improve reporting accuracy and customer communications, it sets a KPI to reduce mismatches to under 2% using automated data validation controls and reconciliation workflows.
2. Data security metrics
Data security metrics evaluate how effectively systems protect sensitive information from breaches, misuse, and unauthorized access. These metrics are critical for frameworks such as ISO 27001, HIPAA, SOC 2, and PCI DSS.
Common data security metrics include:
- Mean time to detect incidents (MTTD)
- Failed login attempts
- Encryption coverage
- Access review completion rate
- Privileged access violations
- Security incident frequency
Example: A fintech company tracks failed access attempts to cardholder systems and notices repeated login attempts outside business hours. To reduce risk, it establishes a KPI of zero unauthorized access incidents per quarter supported by MFA, real-time monitoring, and quarterly access reviews.
Data protection metrics and privacy KPIs
Data protection metrics and data privacy KPIs help organizations measure how effectively they protect personal and sensitive data while meeting regulatory obligations.
Common data protection and privacy metrics include:
- DSAR fulfillment rate
- Privacy incident rate
- Consent coverage
- Data minimization compliance
- Third-party vendor risk metrics
- Cross-border transfer compliance
These metrics are especially important for compliance with GDPR, HIPAA, CCPA, and SOC 2 requirements.
Example: A SaaS provider tracks DSAR response timelines and discovers that only 87% of requests are fulfilled within SLA. To improve GDPR compliance, it automates request tracking and assigns ownership to privacy teams.
3. Data availability metrics
Data availability metrics measure whether data remains accessible, reliable, and performant when needed for business operations.
Common data availability metrics include:
- SLA compliance
- Query latency
- Downtime frequency
- System uptime
- Data recovery time
Example:A logistics company monitors uptime for its route optimization systems and notices performance degradation during peak traffic periods.. It establishes a KPI of maintaining 99.9% uptime and sub-two-second query latency through infrastructure optimization and load balancing.
4. Data compliance metrics
Data compliance metrics measure how effectively organizations meet regulatory, contractual, and internal governance requirements.
Common compliance metrics include:
- Audit readiness score
- Open policy exceptions
- Evidence collection coverage
- Compliance control pass rate
- Percentage of overdue remediation actions
Example: A cloud provider tracks the percentage of DSARs completed within regulatory deadlines. With current compliance at 85%, the organization sets a KPI to reach 100% through workflow automation and clearer accountability.
5. Governance training and awareness metrics
These metrics evaluate how effectively employees understand and follow governance policies, security procedures, and compliance requirements.
Common training and awareness metrics include:
- Governance training completion rate
- Phishing simulation performance
- Governance policy acknowledgment rate
- Security awareness participation rate
Example: An enterprise implementing ISO 27001 identifies that only 88% of employees completed mandatory governance training. It establishes a KPI of reaching 100% completion within 60 days.
6. Data ownership and stewardship metrics
These metrics assess whether accountability for data assets is clearly assigned and consistently maintained across the organization.
Common stewardship metrics include:
- Steward assignment coverage
- Time to ownership resolution
- Percentage of unassigned datasets
- Steward response time
Example: A bank discovers that only 60% of critical datasets have assigned owners. To strengthen accountability, it sets a KPI to achieve full ownership coverage within two quarters.
7. Metadata and data catalog metrics
Metadata and catalog metrics measure how effectively organizational data is documented, classified, and discoverable.
Common metadata metrics include:
- Metadata coverage rate
- Search adoption rate
- Catalog freshness metrics
- Percentage of classified datasets
Example: A SaaS company finds that only 75% of datasets contain complete metadata. It sets a KPI to improve metadata coverage to 95% by embedding documentation into publishing workflows.
8. Policy coverage and enforcement metrics
These metrics measure how consistently governance policies are implemented and enforced across systems, teams, and workflows.
Common policy metrics include:
- Automated enforcement coverage
- Exception remediation time
- Policy violation count
- Percentage of systems covered by governance controls
Example: A healthcare company discovers that only 80% of environments have automated access controls enabled. It establishes a KPI to reach full policy enforcement coverage by quarter-end.
9. Data lifecycle and retention metrics
These metrics evaluate how effectively organizations manage data retention, archival, deletion, and disposal throughout the data lifecycle.
Common lifecycle metrics include:
- Retention policy coverage
- Archived data compliance rate
- Expired data deletion rate
- Storage optimization metrics
Example: A technology company discovers that 20% of datasets lack retention policies. To support GDPR and ISO 27001 compliance, it implements automated lifecycle management workflows and sets a KPI for full retention policy coverage.
Data governance metrics examples by industry
Data governance priorities vary across industries depending on the type of data being handled, regulatory obligations, and operational risks. Tracking industry-specific data governance metrics helps organizations focus on the controls and KPIs that matter most to their business.
Healthcare data governance metrics
Healthcare organizations manage large volumes of protected health information (PHI), making privacy, accuracy, and access control critical governance priorities.
Common healthcare data governance metrics include:
- PHI access review completion rate
- HIPAA incident frequency
- Patient data accuracy rate
- Medical record completeness
- Unauthorized access attempt rate
- Data retention compliance for patient records
Example: A healthcare provider tracks PHI access reviews quarterly and establishes a KPI of 100% review completion to strengthen HIPAA compliance and reduce unauthorized access risks.
Financial services governance KPIs
Financial institutions rely on strong governance controls to protect sensitive financial data, prevent fraud, and maintain compliance with frameworks such as PCI DSS, SOX, and GDPR.
Common financial services governance KPIs include:
- PCI DSS access control compliance rate
- Fraud detection latency
- Financial reconciliation accuracy
- Failed transaction monitoring rate
- Privileged access review completion
- Audit evidence collection coverage
Example: A banking institution measures fraud detection response time and sets a KPI to investigate high-risk anomalies within 15 minutes to reduce financial exposure.
SaaS and technology governance metrics
SaaS and technology companies often focus on privacy compliance, customer data protection, vendor oversight, and scalable governance processes.
Common SaaS governance metrics include:
- DSAR fulfillment rate
- Vendor security assessment completion
- Customer retention policy coverage
- Encryption coverage for customer data
- Metadata classification coverage
- Access provisioning and deprovisioning timelines
Example: A SaaS company preparing for SOC 2 tracks vendor security assessments across all critical third parties and sets a KPI of completing reviews for 100% of high-risk vendors annually.
A data governance scorecard is a structured reporting tool that helps organizations monitor governance performance across areas such as data quality, security, privacy, compliance, and stewardship.
By consolidating data governance metrics and KPIs into a single view, scorecards make it easier to identify gaps, measure progress, demonstrate audit readiness, and align governance initiatives with business goals.
A governance scorecard also improves accountability by assigning ownership to specific metrics and helping leadership track trends over time.
Here is an example of what a governance scorecard may look like:
Governance area
KPI
Status
Data quality
98% accuracy
Green
Access reviews
100% completion
Yellow
DSAR compliance
100% completed on time
Green
Encryption coverage
95% encrypted systems
Yellow
Metadata coverage
92% classified datasets
Green
Policy exceptions
<5 unresolved exceptions
Red
Organizations often use governance scorecards to:
- Track governance maturity over time
- Monitor compliance readiness
- Identify operational bottlenecks
- Improve executive reporting
- Prioritize remediation efforts
Whether preparing for SOC 2, GDPR, HIPAA, or ISO 27001 audits, a governance scorecard helps transform raw governance data into actionable business insights.
How a data governance scorecard helps track performance metrics
A data governance scorecard is a structured reporting tool that helps organizations monitor governance performance across areas such as data quality, security, privacy, compliance, and stewardship.
By consolidating data governance metrics and KPIs into a single view, scorecards make it easier to identify gaps, measure progress, demonstrate audit readiness, and align governance initiatives with business goals.
A governance scorecard also improves accountability by assigning ownership to specific metrics and helping leadership track trends over time.
Here is an example of what a governance scorecard may look like:
Organizations often use governance scorecards to:
- Track governance maturity over time
- Monitor compliance readiness
- Identify operational bottlenecks
- Improve executive reporting
- Prioritize remediation efforts
Whether preparing for SOC 2, GDPR, HIPAA, or ISO 27001 audits, a governance scorecard helps transform raw governance data into actionable business insights.
How to report on data governance metrics effectively
Tracking governance metrics is only valuable if the results are easy to interpret and act on. Effective reporting helps organizations identify risks early, demonstrate compliance readiness, and give leadership visibility into governance performance across the business.
Use Master Data Management (MDM) systems
Master Data Management (MDM) systems help organizations maintain consistent, accurate, and standardized data across business units and applications. Centralizing critical data improves reporting reliability and reduces inconsistencies in governance metrics.
Centralize reporting with governance tools
Data governance and GRC platforms help consolidate governance metrics, compliance evidence, ownership records, and audit data into a centralized reporting environment. This improves visibility and simplifies reporting workflows across teams.
Automate data collection and evidence tracking
Manual reporting is time-consuming and often leads to inconsistent or outdated metrics. Automating evidence collection, access reviews, policy tracking, and compliance monitoring helps organizations maintain real-time visibility into governance performance.
Automation is especially valuable for frameworks such as SOC 2, GDPR, HIPAA, and ISO 27001, where continuous monitoring and audit evidence are essential.
Use dashboards for real-time visibility
Governance dashboards provide visual visibility into key metrics, trends, risks, and remediation activities.
Common dashboard metrics include:
- Data quality scores
- Open policy exceptions
- Access review completion rates
- DSAR fulfillment status
- Encryption coverage
- Vendor risk status
- Governance training completion
Executive dashboards should focus on high-level governance outcomes, while operational dashboards can provide more detailed technical metrics for governance teams.
Include board-level reporting KPIs
Board-level reporting should focus on governance risks that impact business operations, compliance exposure, customer trust, and financial performance.
Common board-level governance KPIs include:
- Audit readiness score
- Number of unresolved high-risk issues
- Privacy incident trends
- Regulatory compliance status
- Percentage of critical systems covered by governance controls
- Third-party risk exposure
Leadership reporting should prioritize trends, business impact, and remediation progress rather than raw technical data.
Prepare for audit readiness continuously
Organizations should treat governance reporting as a continuous process rather than a one-time audit activity. Maintaining updated evidence, access logs, policy records, and compliance metrics helps reduce audit preparation time and improves governance maturity.
Incorporate AI governance reporting
As organizations adopt AI systems and automated decision-making tools, governance reporting increasingly includes AI-related metrics such as:
- AI model transparency
- Bias testing coverage
- AI access controls
- Training data lineage
- Regulatory compliance for AI systems
AI governance reporting is becoming especially important as new regulations and frameworks around responsible AI continue to evolve.

Tools for monitoring data governance metrics
Managing data governance metrics manually becomes difficult as organizations scale their data environments, compliance obligations, and reporting requirements. Governance tools help centralize visibility, automate evidence collection, improve reporting accuracy, and reduce operational overhead.
Data governance platforms
Data governance platforms help organizations manage governance policies, ownership, stewardship workflows, and governance KPIs from a centralized environment.
Common capabilities include:
- Governance policy management
- Data stewardship workflows
- Ownership tracking
- Governance scorecards
- Compliance monitoring
- Risk reporting
These platforms are commonly used to improve governance maturity and standardize governance processes across teams.
Compliance automation tools
Compliance automation tools help organizations continuously monitor controls, collect evidence automatically, and simplify audit preparation workflows.
Common capabilities include:
- Automated evidence collection
- Continuous compliance monitoring
- Access review tracking
- Policy management
- Audit readiness reporting
- Risk assessment workflows
Organizations managing SOC 2, ISO 27001, GDPR, or HIPAA requirements often use governance and compliance automation platforms to centralize governance metrics, automate evidence collection, and simplify reporting workflows.
Metadata and catalog tools
Metadata and data catalog tools improve visibility into organizational data assets and help governance teams classify, discover, and manage data more effectively.
Common capabilities include:
- Data discovery
- Metadata classification
- Data lineage mapping
- Search and catalog management
- Ownership assignment
- Sensitive data identification
These tools help improve metadata coverage, stewardship accountability, and governance transparency.
Dashboard and BI tools
Dashboard and business intelligence (BI) tools help organizations visualize governance KPIs and operational trends in real time.
Common use cases include:
- Governance scorecards
- Executive reporting dashboards
- Compliance status reporting
- Security trend analysis
- Data quality monitoring
- Audit readiness tracking
Real-time dashboards help leadership teams identify governance gaps faster and make more informed operational decisions.
Common obstacles to tracking data governance metrics
Many organizations struggle to maintain accurate and consistent governance reporting due to operational, technical, and organizational challenges.
Common obstacles include:
Siloed ownership
Governance responsibilities are often spread across security, compliance, IT, legal, and business teams. Without clear ownership, governance metrics become inconsistent and difficult to maintain.
Poor metadata hygiene
Incomplete or outdated metadata makes it difficult to classify data, assign ownership, and generate reliable governance reports.
Lack of executive buy-in
Governance initiatives often lose momentum when leadership views governance as a compliance exercise rather than a business priority. Without executive support, governance KPIs may not receive sufficient attention or resources.
Manual reporting fatigue
Many organizations still rely on spreadsheets and manual evidence collection processes. This creates reporting delays, inconsistent metrics, and increased audit preparation workloads.
Inconsistent metric definitions
Different teams may define governance metrics differently, leading to conflicting reports and unreliable benchmarking across the organization.
Limited automation
Without automated monitoring and reporting workflows, governance teams struggle to maintain continuous visibility into data quality, compliance, security, and privacy metrics.
Rapidly expanding data environments
As organizations adopt more cloud applications, AI systems, and third-party platforms, governance reporting becomes more complex and difficult to scale manually.
Best practices for tracking data governance metrics
Tracking data governance metrics effectively requires more than collecting numbers. Organizations need consistent processes, clear ownership, and measurable business outcomes to ensure governance programs deliver real value.
Standardize metric definitions
Teams should use consistent definitions for governance metrics across the organization. Standardized definitions improve reporting accuracy, benchmarking, and cross-functional alignment.
Align KPIs with business goals
Governance KPIs should support broader organizational priorities such as compliance readiness, operational efficiency, customer trust, and risk reduction. Metrics that lack business relevance often fail to gain executive support.
Automate evidence collection
Manual evidence collection slows reporting and increases the risk of incomplete or inconsistent audit data. Automating evidence collection improves visibility, reduces operational overhead, and simplifies compliance reporting.
Assign clear ownership
Every governance metric should have a clearly assigned owner responsible for monitoring performance, resolving gaps, and maintaining accountability.
Review metrics quarterly
Governance metrics should be reviewed regularly to identify trends, reassess priorities, and adjust governance strategies based on evolving risks and business requirements.
Use dashboards for visibility
Dashboards help governance teams and leadership monitor governance performance in real time. Visual reporting also improves communication across technical and non-technical stakeholders.
Build governance accountability
Governance becomes more effective when teams understand their responsibilities and governance outcomes are tied to operational goals and performance expectations.
Use a governance scorecard template to benchmark your current governance maturity.
How to implement data governance metrics: 5-step framework
Implementing governance metrics successfully requires a structured and repeatable framework that aligns governance objectives with operational and compliance goals.
1. Define governance objectives
Start by identifying what the organization wants to achieve through governance initiatives, such as improving data quality, reducing compliance risk, strengthening privacy controls, or improving audit readiness.
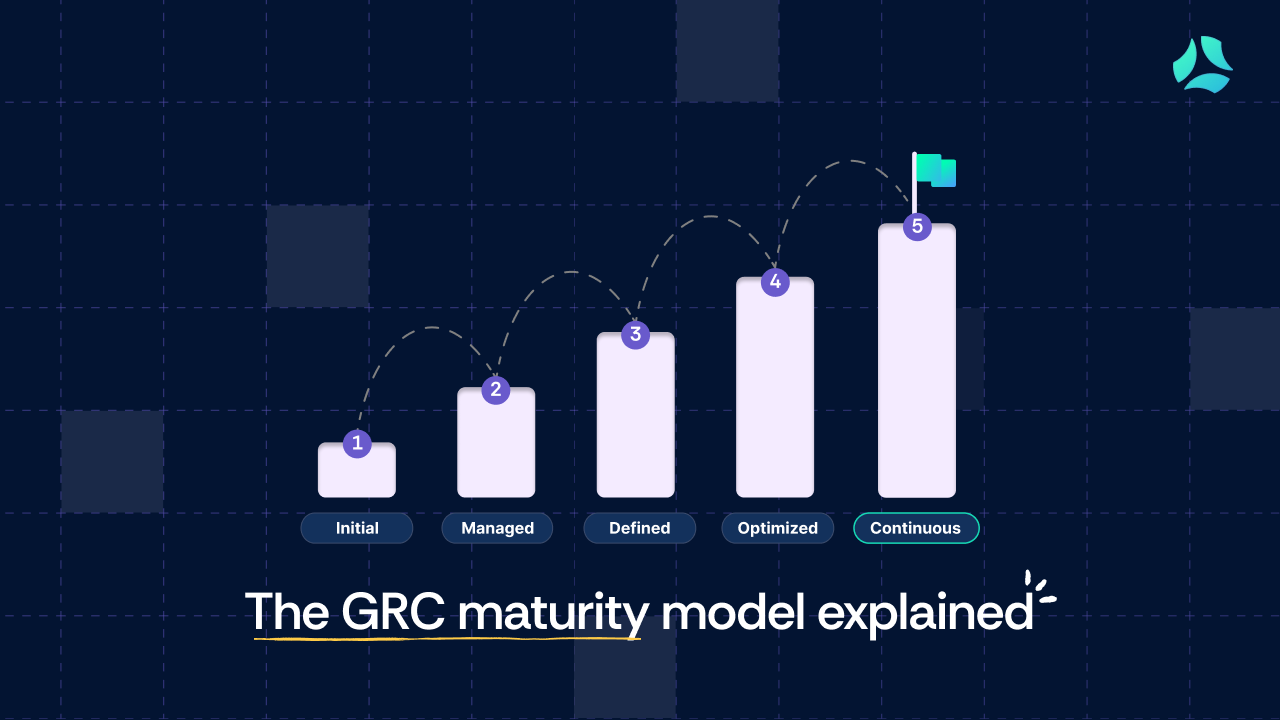
2. Align metrics with governance maturity
Organizations at different governance maturity levels require different KPIs. Early-stage programs may focus on ownership and policy coverage, while mature programs often prioritize automation, continuous monitoring, and advanced risk reporting.
3. Identify stakeholders and assign ownership
Successful governance programs require collaboration between security, compliance, legal, IT, and business teams. Assigning ownership ensures accountability for each metric and reporting process.
4. Automate data collection and reporting
Automating evidence collection, monitoring, and reporting workflows improves consistency and reduces manual reporting fatigue. Automated governance monitoring also supports continuous compliance efforts.
5. Establish a quarterly review cadence
Governance metrics should be reviewed quarterly to assess progress, identify emerging risks, and refine governance priorities based on business and regulatory changes.
Common mistakes organizations make with governance KPIs
Even mature organizations often struggle to build effective governance reporting programs. The most common challenges usually stem from poor prioritization, unclear ownership, and overly complex reporting processes.
Tracking too many KPIs
Monitoring too many governance metrics creates reporting noise and makes it difficult to focus on the KPIs that matter most to the business.
Measuring activity instead of outcomes
Many organizations measure operational activity rather than business impact. For example, tracking the number of completed reviews is less valuable than measuring whether those reviews reduced risk exposure.
Ignoring business alignment
Governance metrics that are disconnected from business goals often fail to gain executive support or demonstrate measurable value.
Not automating reporting
Manual reporting processes increase operational overhead and make governance metrics harder to maintain consistently over time.
Missing ownership and accountability
Governance programs become ineffective when no individual or team is accountable for monitoring and improving KPI performance.
Failing to review metrics regularly
Governance priorities evolve as organizations grow, adopt new technologies, or face new regulations. Metrics that are not reviewed regularly can quickly become outdated or irrelevant.
Data governance metrics are measurable indicators used to evaluate how effectively an organization manages data quality, security, privacy, compliance, accessibility, and stewardship. These metrics help organisations monitor governance performance, identify risks, improve audit readiness, and measure the success of governance initiatives.
Data governance metrics measure operational activities such as access reviews, data quality scores, or policy exceptions. Data governance KPIs are strategic measurements tied to business goals, compliance outcomes, or governance success. Metrics track performance data, while KPIs measure whether governance objectives are being achieved.
The seven core data quality metrics are: Accuracy Completeness Consistency Timeliness Uniqueness Validity Integrity These metrics help organizations evaluate whether data is reliable, usable, and compliant with governance standards.
The five pillars of data governance are: Data Quality Data Security Data Privacy & Compliance Data Stewardship Data Lifecycle Management Together, these pillars help organisations maintain secure, accurate, compliant, and well-managed data environments.
Data protection metrics are measurements used to evaluate how effectively organisations protect sensitive and personal data. Common data protection metrics include encryption coverage, DSAR fulfillment rates, privacy incident frequency, consent management coverage, vendor risk metrics, and cross-border compliance monitoring.


.png)